DTrace: Dynamic Tracing 101
DTrace is an observability tool, enabling users to observe the software running on their systems in an unprecedented manner. We present an overview of what it can do for you.

DTrace is a software technology that enables the dynamic instrumentation of unmodified system software, both the operating system (kernel) and applications; users can observe the entire software stack using the same tool. DTrace is used primarily through the use of the dtrace (1M) command line utility or by the execution of scripts written in the D language (more on this in just a bit).
DTrace was introduced in the first release of Solaris 10 (Solaris 10 3/05) in March 2005, and has since been ported to Mac OS X (10.6) and FreeBSD (7.1). In this article, we introduce DTrace, describe the key features and components, explain when and why you would use DTrace, and discuss the benefits it offers.
DTrace is an observability tool, enabling users to observe the software running on their systems in an unprecedented manner; tracing execution flow, capturing interesting and relevant data, profiling the kernel and applications ... these are just some of the things that can be accomplished with DTrace. The target software does not require modification -- DTrace instrumentation is dynamic. DTrace is used primarily for analyzing software to understand and improve performance, capacity planning and utilization, and general software debugging. The power of DTrace is expressed simply and succintly by father of DTrace Bryan Cantrill: "DTrace allows you to ask arbitrary questions about what the system is doing, and get answers."
Using DTrace, we can instrument our systems and applications to determine:
- Which user processes are consuming CPU cycles or doing memory allocations
- What area of the operating system (kernel) is using CPU
- Which files are getting read and written by applications
- Which component of my software stack is generating file I/O or network I/O
- How long it takes to read or write a specific file
- How long application threads wait to get on a CPU
- Which application processes are generating page faults
The list of possible questions that can be answered is virtually endless. All aspects of software execution can be observed and understood using DTrace.
DTrace: Uses and Users
DTrace is used for detailed observability of system software, performance analysis, and troubleshooting software bugs. DTrace enables capturing data on all hardware resources, such as CPUs and disk and network activity, application and kernel tracing, and profiling. For performance analysis, DTrace can be used to measure time spent in various code segments and function calls, to determine where applications are spending time, and for generating latency measurements. With DTrace, the user can determine what the problem is (and is not) and measure the magnitude and impact of the problem.
DTrace is a versatile and powerful tool that can and should be used by a wide range of technology professionals and students. Application developers can use DTrace to capture in-flight profiling data without the need to restart or recompile applications, including production systems. They can trace code flow and see how their applications interact with the kernel and other software modules. Also, developers can add static DTrace probes to their code for a stable debug interface. Support personnel will get comprehensive insight into application behavior, and be able to determine the root-cause of performance problems and other software failures.
Systems administrators, armed with DTrace, will be able to determine the root cause of problems on systems much more quickly and efficiently, and observe areas of the system not previously possible. For database administrators, using DTrace enables measuring and observing the core database software as well as other areas of the system that get called by the database software stack, and observe how they interact.
Security personnel can use DTrace to customize short-term auditing and decipher malware. Kernel engineers can use DTrace to conduct function-call tracing of their code, capturing useful data along the way, looking for opportunities to optimize their code by getting fine-grained time measurements on function execution. Function-call arguments can be traced and users can capture specific data-structure members when arguments include structure pointers. Statically defined trace points can be added to kernel code for even more effective debugging.
Finally, students can use DTrace as they develop skills in software development, study software architecture, and learn more about how operating systems work.
Why DTrace?
Tools and utilities used for observing systems fall into one of two categories: those that are system-centric and those that are application-centric. System-centric utilities typically found on modern operating systems capture and report metrics about what the kernel is doing and about utilization of various subsystems (CPUs, storage, networks). It is useful information and a necessary part of any performance analysis or debugging process, but the tools and utilities do not correlate system activity with the running applications.
For example, tools such as iostat(1M) in Solaris can tell us about reads and writes, throughput, etc., on a per-disk basis, but not where the reads and writes originate, which processes are generating them, and which files are accessed. Tools such as netstat(1M) provide packet rates and throughout information about network interfaces, but do not contain information about the origin of the network traffic.
Process- or application-centric tools, such as traditional debuggers or the Process File System (ProcFS) utilities, can tell us what the applications are doing, but it is not easy or intuitive to correlate the information to the metrics gathered at the system level.
Connecting the Dots
DTrace connects the dots by providing a facility for correlating system metrics to the application processes and threads that are generating the system activity. For example, observing the output of iostat(1M) on a Solaris system shows read activity on a per-disk device basis. It's good information, but the next set of logical questions are, "Which files are being read?" and "Which processes are reading them?"
It was extremely difficult, if not impossible, to get these answers without DTrace, but now we can connect the dots and correlate the disk I/O load reported by the system tool to the application(s) generating the logical I/Os, some of which the underlying file system turns into physical disk I/O:
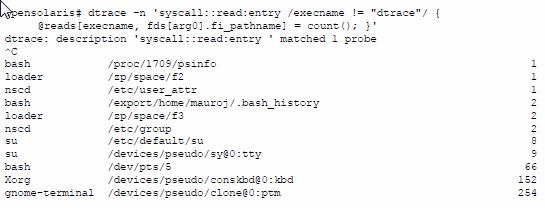
This example shows the dtrace(1M) command line utility being used to enable a probe at the entry point of the read(2) system call. The other components of the command line will be described in the section below. What is critically important to note here is that with a relatively simple DTrace invocation, we understand so much more about what may be causing the disk I/O load on the system.
We see which processes are generating reads (leftmost data in each line), which files they are reading (center value in each line above), and how many times they issued a read to that file while DTrace was running (rightmost data), e.g. the gnome-terminal process issued a read(2) on the /devices/pseudo/clone@0:ptm file 254 times during the execution of the dtrace(1M) command.
Of course, this is just one example; we could explore this activity in even more detail with DTrace, tracking the size of each read, the amount of time each read takes, etc. Before getting into other examples of using DTrace, we'll briefly cover the components of DTrace.
DTrace Components
DTrace instruments software by the dynamic insertion of instrumentation points called probes. A probe is typically inserted in the code path of executing software, most often at the entry and return points of function calls. When a probe in enabled and the code path where the probe exists is executed, the probe "fires," entering the DTrace subsystem and taking whatever actions the user defined in the dtrace(1M) invocation.
After DTrace completes the specified actions, software execution continues. Along with a probe specification, DTrace provides a predicate mechanism for defining conditions of interest when the probe fires, and action statements -- what to do when the probe fires.
DTrace probe names are made up of a 4 tuple set, each component separated by a colon
provider:module:function:name;
Where:
- Provider is a library of related probes
- Module refers to the module the instrumented functions belongs to, either a kernel module or user segment
- Function is the name of the function containing the probe
- Name is the name of the probe
In our example (syscall::read:entry), we specified the syscall provider, we did not specify a module name, thus the field is blank. We specified the read function, and the entry probe name.
Here's another example of a probe:
io:genunix:default_physio:start
where io is the provider, genunix is the module (in this case, a kernel module), default_physio is the function where the probe resides, and start is the name of the probe.
Available probes can be listed using "dtrace -l":
Example 1:
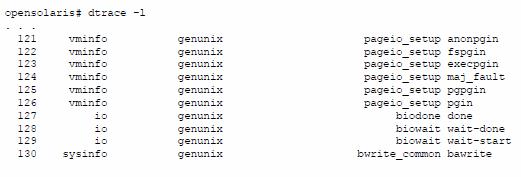
Example 2:
opensolaris# dtrace -l | wc -l
70822
In Example 1, we show just a very small sample of the output of "dtrace -l", since, as you can see from Example 2, there are 70822 DTrace probes available on this system. The listing provides, starting from the left column, the numeric ID of the probe, the provider, the module, function, and the probe name. Note the number of probes will vary from system to system, depending on several factors, such as the version/release of the operating system or the number of kernel modules loaded.
In addition to probes, the other key components of DTrace include:
- A predicate mechanism for data filtering
- A simple scripting language (called D) for defining probes, predicates, and data gathering actions
- A rich set of built in variables for capturing key data
- A set of built-in functions for building powerful D scripts
- User-defined variables for creating more sophisticated analysis scripts with D
- Integrated data aggregating for pruning data at the source
A typical DTrace invocation has the form:
probe /optional predicate/ { actions to take when probe fires }
Let’s break down our previous example piece by piece and describe how all the components fit together and what they are. Here's the command line again;
User enters:
opensolaris# dtrace -n 'syscall::read:entry /execname != "dtrace"/ { @reads[execname, fds[arg0].fi_pathname] = count(); }' dtrace: description
System responds:
'syscall::read:entry ' matched 1 probe
Where:
- dtrace -n - dtrace(1M) with the "-n" flag means a probe name will follow
- syscall::read:entry is the probe name (enabling a probe at the entry point of read(2))
- /execname != "dtrace"/ is a predicate. DTrace predicates are defined between // characters and evaluated as logical expressions, meaning they evaluate either true or false. DTrace evaluates predicates when the probe fires. If the predicate evaluates true, the specified action is taken. If the predicate evaluates false, the action is not taken. In this example, the predicate uses a DTrace built-in variable, execname, which is the name of the process running on the CPU when the probe fires. This predicate equates to "if the process name is not equal to dtrace". In other words, we only want to take action (collect data) if the running process is anything except the dtrace process. We're not interested in observing reads from dtrace.
- { @reads[execname, fds[arg0].fi_pathname] = count(); } is the action to take when the probe fires and the predicate evaluates true. In this case, we have defined an aggregation variable, @reads. The @ symbol denotes this as an aggregation variable, and reads is the variable name. Aggregation variables are similar to associative arrays -- they can be indexed using one or more keys. In this case, we maintain an index to our @reads aggregation using two keys: the execname built-in variable, and the pathname of the file being read (derived from another internal DTrace variable, the fds[] array). In this example, we're asking DTrace to count all the reads, using the count() aggregating function, and maintain the counts based on the process name and file pathname.
For clarity, let's simplify the example and build it up.
syscall::read:entry { @reads = count(); }
In this example, we use the same probe, but we leave out the predicate (it is optional), and in the action, we simply have a reads aggregation variable that is not indexed. Thus, the result of running the above would be a numeric value representing a count of every time the read system call was executed. If we add a predicate:
syscall::read:entry /execname != "dtrace"/ { @reads = count(); }
We will count all the reads unless the process name is dtrace.
syscall::read:entry /execname != "dtrace"/ { @reads[execname] = count(); }
We will count all the reads unless the process name is dtrace, and generate a count per-process name, as we have now added execname as an index to the aggregation.
Finally:
syscall::read:entry /execname != "dtrace"/ { @reads[execname, fds[arg0].fi_pathname] = count(); }
This is our original example, adding the file pathname as an aggregation key. Note the fds[] array is not yet implemented in FreeBSD.
The above set of examples illustrates one of the powerful benefits of DTrace - building on one script or command line after another, as one's investigation gets closer to the problem, and adding predicates and changes to the actions as you drill-down. This methodology aligns with efficient root-cause analysis of system/application performance problems and general software debugging.
Summary
DTrace provides visibility into systems software in ways not previously possible. In this article, we attempted to introduce the reader to DTrace and convey its power. Systems performance analysis and software debugging is a complex topic, and DTrace is an extremely powerful tool for getting the job done. We encourage readers to use DTrace and continue their explorations using the reference material described below
- - -
Jim Mauro is a Senior Software Engineer at Oracle where he is responsible for systems performance projects and solving customer’s performance problems, You can contact Mr. Mauro at [email protected].
Brendan Gregg is a Performance Specialist at Joyent where he is responsible for implementing DTrace based analytics for cloud computing, You can contact Mr. Gregg at [email protected].
References:
DTrace - Dynamic Tracing in Oracle Solaris, Mac OS X and FreeBSD Prentice Hall April 2011. ISBN 0-13-209151-8; http://www.dtracebook.com
Online DTrace Wiki: http://wikis.sun.com/display/DTrace/Documentation
Miscellaneous DTrace Topics: http://www.solarisinternals.com/wiki/index.php/DTrace_Topics