In-Depth
A 4-Phase Approach to Socializing Business Analytics
How your BI team can communicate your focus on delivering solutions rather than the use of tools and technology.
- By David Loshin
- 11/29/2011
[Editor’s Note: David Loshin is presenting sessions on Organizational Readiness for Business-Oriented Analytics: A Manager’s Guide and Understanding the Value of a Business Analytics Program: A Manager’s Guide at the TDWI World Conference in Las Vegas, February 12-17, 2012.]
One of the biggest challenges of the early days of organized reporting and analytics was the complexity associated with data collection, organization, and alignment in preparation for loading data into a warehouse/mart/repository to be used as the basis for generating reports. The level of effort necessary to create and maintain the reporting and analytics environment was a limiting factor: only those organizations willing to invest the resources and time in developing a business intelligence framework were able to take advantage of increased business insight.
Even with the significant investment, an organization required different levels of expertise in making the available tools work together, whether that meant specific knowledge needed for extraction and transformation, data quality, data warehouse loading, creation of data marts, reporting engines, or knowledge of data mining tools and techniques -- and that was before you even start to address the needs of the business users!
Twenty years or so later, many of those early data integration challenges been solved, and the sophistication of the available tools (in terms of features and interoperability) has led to a corresponding increased user sophistication. Typical market movements (such as the growth of best-of-breed vendors, mergers, and acquisitions) coupled with improvements in processes that use technology have led to implicit standards in the ways that data integration, data warehousing, and data analysis tools are used. In addition, the “bleeding edge” technologies of the mid-1990s (such as massive parallelism, data mining technologies, and data virtualization) are now common “dial-tone” services; many community and open source tools employ these technologies that effectively lower the barrier to entry for midsized or even small businesses.
More simply, what was hard and expensive to do 20 years ago is now generally available, and the users don’t need advanced degrees in computer science or statistics to benefit from tool use. Instead of investing significant amounts of resources in getting the infrastructure in place and figuring out how the tools are used, enterprises can concentrate on using the tools to get results.
That being said, we have been exploring ways to standardize the approach a business intelligence and analytics team can take to streamline the provision of “analytics services” to business users in a way that communicates the delivery of solutions to business problems instead of the acquisition and installation of tools and technology. This concept is the focus of my upcoming courses at the TDWI World Conference in Las Vegas. Essentially, once the team is comfortable with the data analysis infrastructure and the analytic techniques, working with the business partner centers more on knowledge transfer for key analysis disciplines using the technology to drive the creation of value.
Conceptually, this standard approach spans the four phases shown in the figure below:
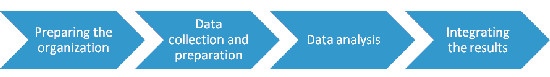
Phase 1: Organizational Preparation
There is a level of confidence in knowing that business intelligence and data analysis tools can be configured and tweaked to aggregate, analyze, and deliver results in ways that accommodate the perspectives of the different types of users. With this in mind, the initial phase is intended to establish objectives and key measures for success. Some example subtasks include:
- Defining or isolating one or more business objectives (such as increasing revenue, reducing customer attrition, or reducing loss attributable to fraud)
- Establishing quantifiable measures for the objective(s) (such as “monthly customer retention rate”)
- Defining justifiable target(s) for success with respect to defined measures (“increase monthly customer retention rate from 85 percent to 92 percent”)
- Selecting the business processes whose improvements will lead to corresponding improvements in the business objectives
- Engage business process owners to assess their information needs and expectations for delivery of actionable knowledge.
Phase 2: Data Collection and Preparation
Once the participants are prepared for incorporating analytics into their business processes, the next step is to identify the data sources and make the information available. That implies the need to get high quality data in the right format as a prelude to the actual analysis. Steps include:
- Selecting the candidate data sources based on the expectations specified by the business end users
- Performing a data quality analysis of those data sets to determine their suitability for analysis
- Designing data models used within an analytical framework
- Extracting, transforming, and other preparations for organizing the source data into a format that is fit for its subsequent uses
Phase 3: Data Analysis
The analysis itself is cyclical in nature. Once a series of computations and analyses are performed, the delivered knowledge can be reviewed and steps can be taken to improve the processes under investigation. Positive results provide positive feedback to the analysis cycle -- business processes can be adjusted to see which changes provide the best results, and analysis models can be tweaked in response to the process changes. This iterative cycle of refinement helps you achieve the greatest benefits. Non-beneficial results suggest changing or eliminating other reports and analyses. Some example tasks performed during this stage include:
- Identifying the models that provide the greatest business benefit
- Synthesis of the results from each iteration and assessing potential opportunities presented
- Reviewing the results and validating that what is being presented is consistent with expectations as well as whether the data preparation and analysis processes did not introduce errors or inconsistencies into the data
Phase 4: Incorporate Results
Once the analytical models have been reviewed and validated, business processes can be adjusted to take advantage of newly discovered knowledge. Typical steps include:
- Evaluating change scenarios based on the presented results (“what-if analysis”)
- Modifying any processes in ways that exploit the actionable knowledge
- Instituting performance measures and monitoring to seek continuous opportunities for improvement
Considerations
If you quickly review these tasks lists, you will see that the technology aspects are somewhat muted. Because there are reliable methods and tools supporting most of the underlying activities, you can deemphasize the focus on implementation and accentuate the concentration on the business needs and the integration of the results. At that point, recognition of a positive business feedback loop will then be the best method for communicating the value of a standardized approach to analytics.