In-Depth
How to Use the New Analytic Functions in SQL Server 2012
Learn how the new functions that perform calculations on ordered data sets in this excerpt from "Murach's SQL Server 2012 for Developers."
Excerpt from Murach's SQL Server 2012 for Developers by Bryan Syverson and Joel Murach; copyright 2012; published by Mike Murach & Associates, Inc. (www.murach.com); 794 pages, ISBN: 978-1-890774-69-1, $54.50. Used by permission of the publisher.
How to Use the Analytic Functions
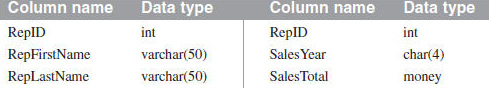
In addition to the other new functions you’ve learned about in this chapter, SQL Server 2012 introduced the new analytic functions. These functions let you perform calculations on ordered sets of data. Figure 9-15 (at end of excerpt) illustrates how these functions work. Note that all of the examples in this figure use the SalesReps and SalesTotals tables that are summarized in this figure. These tables are related by the RepID column in each table.
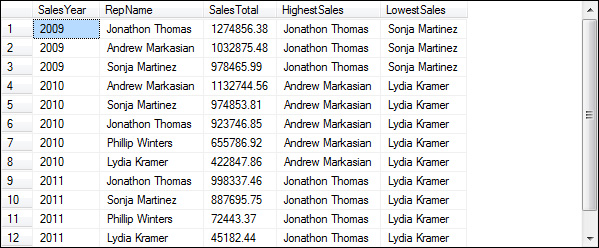
The FIRST_VALUE and LAST_VALUE functions let you return the first and last values in an ordered set of values. The first example in this figure uses these functions to return the name of the sales rep with the highest and lowest sales for each year. To do that, the OVER clause is used to group the result set by year and sort the rows within each year by sales total in descending sequence. Then, the expression that’s specified for the functions causes the name for the first rep within each year to be returned.
For the LAST_VALUE function to return the value you want, you also have to include the RANGE clause as shown here. This clause indicates that the rows should be unbounded within the partition. In other words, all of the rows in the partition should be included in the calculation. If you don’t include this clause, the LAST_VALUE function will return the last value for each group specified by the ORDER BY clause. In this case, that means that the function would return the last rep name for each sales total. Since all of the sales totals are different, though, the function would simply return the name of the rep in each row, which isn’t what you want. So, you would typically use this clause only if you sorted the result set by a column that contains duplicate values. In that case, you can typically omit the PARTITION BY clause.
Instead of the RANGE clause, you can code a ROWS clause on a FIRST_VALUE or LAST_VALUE function. This clause lets you specify the rows to include relative to the current row. For more information on how to code this clause and the RANGE clause, please see the Books Online discussion in this book.
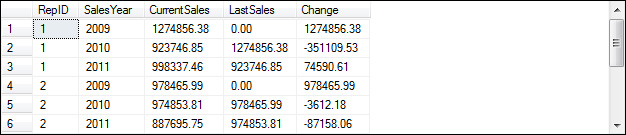
The LEAD and LAG functions let you refer to values in other rows of the result set. The LAG function is illustrated in the second example in this figure. Here, the OVER clause is used to group the result set by rep ID and sort it by year. Then, the LAG function in the fourth column gets the sales total from one row prior to the current row (the offset). Since the rows are sorted by year for each sales rep, that means that the function retrieves the sales rep’s sales for the previous year. The fifth column uses the same function, but it subtracts the result of this function from the current sales to show the change in sales from the previous year. The LEAD function is similar, but it lets you refer to values in following rows rather than preceding rows.
Notice that the value of the LAG function for the first row for each sales rep is 0.00. That’s because there isn’t a row for the prior year. By default, this value is NULL. Because I wanted to calculate the change for each row in the result set, though, I set the third argument of the LAG function (default) to 0.
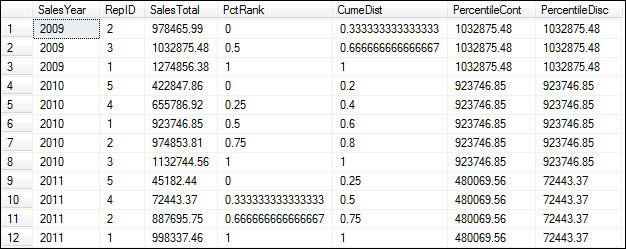
The third example in this figure shows how to use all four of the remaining functions. Each of these functions groups the rows by year and sorts them by sales total in ascending sequence. Notice, though, that the ORDER BY clause for the PERCENTILE_CONT and PERCENTILE_DISC functions isn’t specified on the OVER clause. Instead, it’s specified on the WITHIN GROUP clause, which, unlike the OVER clause, allows for the result set to be sorted only by a single column.
The PERCENT_RANK function calculates a percent that indicates the rank of each row within a group. The result of this function is always a value between 0 and 1. If you study the results in this example, you shouldn’t have any trouble understanding how this function works.
The CUME_DIST function is similar, but it calculates the percent of values that are less than or equal to the current value. This function represents the cumulative distribution of the values. The cumulative distribution is calculated by dividing the number of rows with the current value or a lower value by the total number of rows in the group.
The PERCENTILE_CONT and PERCENTILE_DISC functions calculate the value at the percentile you specify. The difference between these two functions is that PERCENTILE_CONT is based on a continuous distribution of values, and PERCENTILE_DISC is based on a discrete distribution of values. This means that the value returned by PERCENTILE_CONT doesn’t need to appear in the result set, but the value returned by PERCENTILE_DISC does.
In this example, these functions are used to calculate the median of the sales totals for each year (the value in the middle). Because there are an odd number of rows for 2009 and 2010, both functions return the value in the middle row. Because there are an even number of rows for 2011, though, there isn’t a middle value. In that case, the PERCENTILE_CONT function calculates the median by adding the two middle values together and dividing by 2. As you can see, the resulting value doesn’t exist in the result set. In contrast, the PERCENTILE_DISC function uses the CUME_DIST function to identify the row with a cumulative distribution of .5 (the same percentile specified by the PERCENTILE_DISC function), and it uses the value of that row as the result.
Figure 9-15: How to use the analytic functions
The syntax of the analytic functions:
{FIRST_VALUE|LAST_VALUE}(scalar_expression)
OVER ([partition_by_clause] order_by_clause [rows_range_clause])
{LEAD|LAG}(scalar_expression [, offset [, default]])
OVER ([partition_by_clause] order_by_clause)
{PERCENT_RANK()|CUME_DIST} OVER ([partition_by_clause] order_by_clause)
{PERCENTILE_CONT|PERCENTILE_DISC}(numeric_literal)
WITHIN GROUP (ORDER BY expression [ASC|DESC]) OVER (partition_by_clause)
The columns in the SalesReps and SalesTotals tables:
A query that uses the FIRST_VALUE and LAST_VALUE functions:
SELECT SalesYear, RepFirstName + ' ' + RepLastName AS RepName, SalesTotal,
FIRST_VALUE(RepFirstName + ' ' + RepLastName)
OVER (PARTITION BY SalesYear ORDER BY SalesTotal DESC)
AS HighestSales,
LAST_VALUE(RepFirstName + ' ' + RepLastName)
OVER (PARTITION BY SalesYear ORDER BY SalesTotal DESC
RANGE BETWEEN UNBOUNDED PRECEDING AND UNBOUNDED FOLLOWING)
AS LowestSales
FROM SalesTotals JOIN SalesReps
ON SalesTotals.RepID = SalesReps.RepID;
Description
- The FIRST_VALUE, LAST_VALUE, LEAD, LAG, PERCENT_RANK, CUME_DIST, PERCENTILE_CONT, and PERCENTILE_DISC functions are known as analytic functions, and they’re new with SQL Server 2012.
- The FIRST_VALUE function returns the first value in a sorted set of values, and the LAST_VALUE function returns the last value in a sorted set of values. When you use the PARTITION BY clause with LAST_VALUE, you typically include the ROWS or RANGE clause as well.
A query that uses the LAG function:
SELECT RepID, SalesYear, SalesTotal AS CurrentSales,
LAG(SalesTotal, 1, 0) OVER (PARTITION BY RepID ORDER BY SalesYear)
AS LastSales,
SalesTotal - LAG(SalesTotal, 1, 0)
OVER (PARTITION BY REPID ORDER BY SalesYear) AS Change
FROM SalesTotals;
A query that uses the PERCENT_RANK, CUME_DIST, PERCENTILE_CONT, and PERCENTILE_DISC functions:
SELECT SalesYear, RepID, SalesTotal,
PERCENT_RANK() OVER (PARTITION BY SalesYear ORDER BY SalesTotal)
AS PctRank,
CUME_DIST() OVER (PARTITION BY SalesYear ORDER BY SalesTotal)
AS CumeDist,
PERCENTILE_CONT(.5) WITHIN GROUP (ORDER BY SalesTotal)
OVER (PARTITION BY SalesYear) AS PercentileCont,
PERCENTILE_DISC(.5) WITHIN GROUP (ORDER BY SalesTotal)
OVER (PARTITION BY SalesYear) AS PercentileDisc
FROM SalesTotals;
Description
- The LEAD function retrieves data from a subsequent row in a result set, and the LAG function retrieves data from a previous row in a result set.
- The PERCENT_RANK function calculates the rank of the values in a sorted set of values as a percent. The CUME_DIST function calculates the percent of the values in a sorted set of values that are less than or equal to the current value.
- The PERCENTILE_CONT and PERCENTILE_DISC functions calculate the value at the specified percentile for a sorted set of values. PERCENTILE_CONT returns an exact percentile, and PERCENTILE_DIST returns a value that exists in the sorted column.